



A mobile service ROI calculator is only as useful as the inputs it exposes. The better ones let you set appointments per day alongside average repair order, technician cost, and van cost, because appointments per day is the input that decides everything else.
But an input is not a plan. A calculator that lets you type six appointments a day still does not tell you how to get to six. If nothing behind it is built to fill the schedule, the number in that box is doing all the work and none of the lifting.
Why does utilization decide the business case?
Because a small mobile service program has more fixed costs than variable.
Work through a one-van model at a $300 average repair order. At six repair orders a day, five days a week, four weeks a month, you get 120 ROs and roughly $36,000 in monthly service revenue. That is the number the calculator shows you.
Now look at the cost side. In a single-van operation, roughly three-quarters of your monthly cost does not move with volume. The technician gets paid whether the 2pm slot is booked or not. The van payment does not care. Neither does insurance, connectivity, or your software. Only parts, fuel, and a slice of consumables flex with the work you actually do.
What happens to the math at three repair orders a day?
Three ROs per day is where a lot of real programs sit, particularly if they don't have a sufficient scheduling and routing solution. Run the same model there.
Revenue halves, to roughly $18,000. Costs barely move, because three quarters of them were never volume-dependent. In an illustration where the full-utilization version shows $36,000 of revenue against $14,000 of cost, halving utilization takes monthly profit from roughly $22,000 to under $6,000.
Same van. Same technician. Same software. Same everything. One variable, and roughly three quarters of the profit is gone.
To be clear about what this is not: it is not an argument that mobile service does not pencil. Run at real utilization, mobile service is one of the better returns available in fixed operations, and we have dealers whose numbers say so. It is an argument that the number in the appointments-per-day box is an assumption, and an assumption is worth exactly what the proof behind it is worth.
So what should you ask the vendor to prove?
Not whether the math works. The math works at six. Everyone's math works at six.
Ask to see it working somewhere. Three questions cover it.
How many of your dealers average six repair orders per van per day, and how long have they held it?
What in your platform fills the schedule, as opposed to sequencing it once it is already full?
When a dealer's van is running at three, what do you actually do about it?
A vendor who can name stores holding that volume and name the mechanism that fills them is showing you a forecast. A vendor who can do neither is showing you a goal with your capital attached, and the economics conversation is a different one than the spreadsheet suggests.

What else is usually missing from the model?
Two lines, in our experience.
Parts get modeled loosely. Gross margin on mobile work is not a constant. It follows your parts pricing and your job mix, which means the parts figure sitting underneath a projected margin deserves as much scrutiny as the margin itself.
The thing to check in any projection you are handed is the parts cost it implies. Take the parts line, divide it by the repair orders behind it, and look at the number per RO. If it lands in the low twenties on a $300 ticket, a synthetic oil change alone can pass it at a lot of stores. Then compare that implied figure against what your own parts department actually charges out on comparable work. If it sits well below yours, the margin being projected is not the margin you will post, and you will find that out on your operating statement rather than in the spreadsheet.
Coordination is almost never on the sheet at all. One technician, and then nothing. No advisor time writing and closing the RO. No BDC hours filling the schedule. No one rebuilds the route at nine in the morning when two customers move and a third cancels. Coordination is real labor with a real cost, and leaving it out does not make it free.
Why doesn't routing software solve this?
Because routing and utilization are different problems, and only one of them is the one you have.
Route optimization is a throughput answer. Given a set of appointments, it sequences them efficiently. That is genuinely useful once the schedule is full. It does nothing for an empty schedule. A perfectly routed van running three jobs is still a van running three jobs.
A full van beats a perfectly routed empty one, every time.
So what actually fills the van?
Demand you already own, activated on purpose.
Most dealers are sitting on the answer. Open recalls on vehicles in your PMA. Customers who have not been in for twelve months or more. Declined service from the last visit. Connected-vehicle signals telling you an oil change is due. These are not conquest leads. They are your customers, and they convert at rates conquest marketing does not come close to.
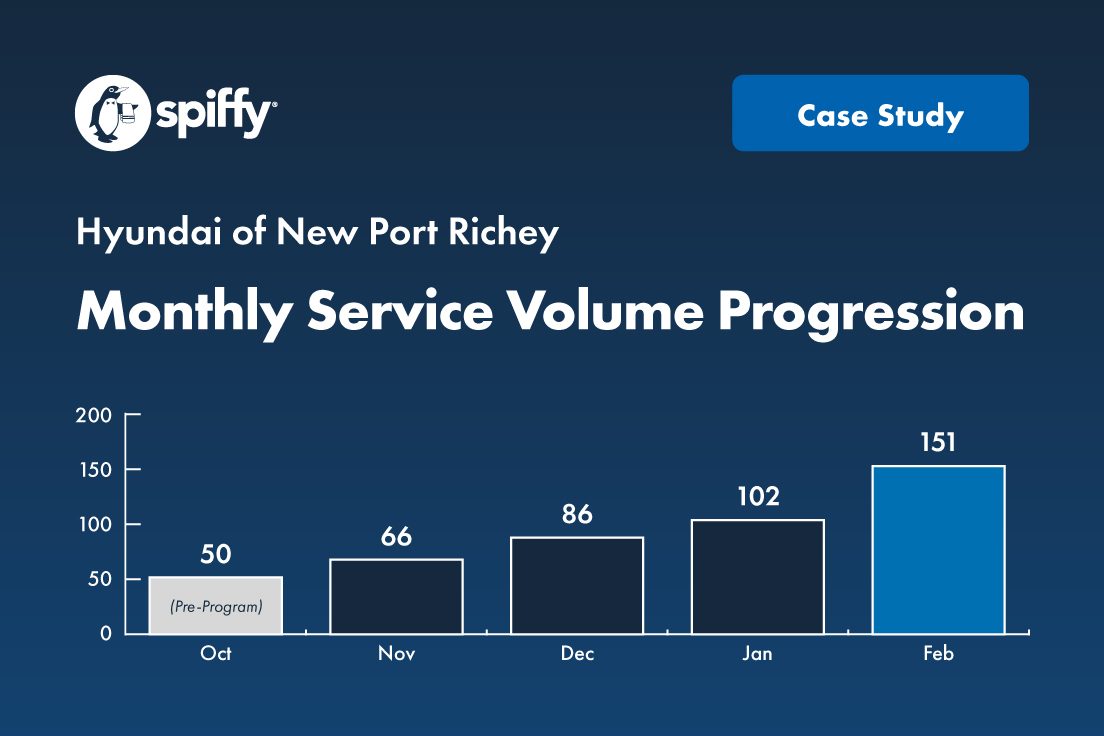
This is the part we tell dealers to focus on first. Not the van. Not the route. The mechanism that fills the schedule before the van pulls out, and the process that closes additional work before it pulls away.
Get utilization right and the rest of the model takes care of itself. Get it wrong and no amount of routing sophistication will save the P&L.
Frequently asked questions
What is a realistic number of repair orders per van per day?
It depends on your market density, your appointment mix, and how deliberately you fill the schedule. Programs that treat utilization as a design problem rather than a marketing afterthought tend to climb from the low single digits into the five-plus range. Programs that assume demand will show up tend to stay where they started.
Should I model six repair orders a day in year one?
We would not. Model the utilization you can actually defend, then model what the program looks like as you fill it. If the business case only works at full utilization, and you have no solution to generate mobile service demand, you do not have a business case yet. You have a goal.
How much of a one-van program's cost is really fixed?
In most structures, roughly three-quarters. The exact split depends on how you compensate technicians and whether the van is financed or owned, but the direction is consistent: your costs are far less elastic than your revenue.
Does mobile service cannibalize my fixed bays?
The pattern we see is the opposite. Mobile absorbs light maintenance that did not need a bay, which frees bay hours for higher-margin work, and it recovers customers who had already stopped coming in. The work that moves to the van is largely work that was leaking to independents anyway. Mobile service also provides touchpoints on the vehicle that often lead to identifying additional service needs.
What is the fastest way to raise utilization on an existing van?
Campaign against lists you already own, starting with open recalls, and make the booking path something a customer can complete without calling the store.
What should I ask a mobile service vendor to prove?
Ask how many of their dealers average five or more repair orders per van per day and how long they have held it. Then ask what in the platform fills the schedule, as opposed to sequencing it. A vendor who can answer both is showing you a forecast. A vendor who can only answer one is showing you a goal.